SYS · REAL-TIME STREAM PROCESSING · CIRCUIT BREAKER · COMPLETE
SYSTEM STATUS · CIRCUIT BREAKER: CLOSED · ALL AGENTS NOMINAL

PHRONIS

Real-time IoT analytics with autonomous agent architecture, Kafka-backed stream processing, and microsecond circuit breaker protection against cascade failures.

<600ms SENSOR TO ALERT
1K+ MSGS/SEC THROUGHPUT
5 CONSUMER BRANCHES
// 01 · THE PROBLEM

WHEN STREAMS
FAIL HARD

Real-time systems fail in one of two ways: they stop working, or they keep working while producing wrong results. The second one is worse. Silent failures at high throughput mean thousands of bad records downstream before anyone notices.

Phronis was built around one constraint: a downstream failure cannot be allowed to cascade. If Grafana is slow, the pipeline cannot back up. If an agent throws, recovery must be automatic, logged, and traceable to a specific message offset.

The circuit breaker pattern, borrowed from electrical engineering, is the mechanism. When a consumer exceeds the failure threshold, the breaker trips open. Traffic routes to the dead letter queue. The remaining consumers keep running. The operator gets an alert in under 600ms.

// CIRCUIT BREAKER · LIVE STATE ● CLOSED
STATECLOSED · NOMINAL
FAILURE THRESHOLD5 errors / 60s window
RECOVERY TIMEOUT30 seconds half-open
DEAD LETTER QUEUEKafka DLQ + Iceberg
ALERT LATENCY<600ms sensor to operator
// 02 · DETECTION TIMELINE

UNDER
600 MS

From sensor event to operator alert. Every millisecond is measurable. Every stage logs to a named Kafka topic. The breaker state is queryable via FastAPI at any point in the chain.

// DETECTION_CHAIN · SENSOR EVENT TO OPERATOR DASHBOARD
T +0ms
Sensor event arrives at Kafka topic phronis.raw.events
KAFKA
T +120ms
Agent consumer ingests from assigned partition. Pydantic schema validation runs before processing begins.
AGENT
T +280ms
Circuit breaker state check. CLOSED: proceed to anomaly detection. OPEN: route to DLQ, skip downstream.
CB CHECK
T +400ms
Anomaly detection threshold exceeded. @tool anomaly_detect() returns True. Agent publishes to alerts topic.
DETECT
T +520ms
Alert event published. Streamlit consumer receives push. Grafana annotation written via API. DLQ archived.
ALERT
T +600ms
Operator dashboard updated. Alert card visible in Streamlit. Grafana panel refreshed. Full trace in structlog.
RESOLVED
// 03 · STREAM ARCHITECTURE

FAN-IN
FAN-OUT

// PHRONIS_PIPELINE · KAFKA BACKBONE · 4 SOURCES · 5 CONSUMERS
INPUT LAYER · 4 SOURCES
SENSOR DATA FastAPI · POST /ingest · asyncio
IoT event payload. Pydantic validation on ingestion. Published to raw.events topic.
HISTORICAL Batch loader · CSV/JSON
Historical event replay. Same schema as live events, same topic routing.
CONFIG UPDATES phronis.config · CB thresholds
Dynamic CB threshold updates without restart. Consumed by all agents.
DEAD LETTER phronis.dlq · retry cadence
Failed messages re-enter with exponential backoff. Traceable to original offset.
↓ KAFKA CONFLUENT BROKER ↓
KAFKA CONFLUENT partitioned topics · consumer groups · offset management
phronis.raw.events · phronis.processed · phronis.alerts · phronis.dlq · phronis.config. Each consumer group reads independently. No shared state between branches.
↓ FAN-OUT · 5 CONSUMERS ↓
OUTPUT LAYER · 5 CONSUMERS
AGENT PROCESSOR @agent · @tool · CB logic
Main processing agent. Circuit breaker wraps every @tool call. Publishes to alerts on anomaly.
GRAFANA Grafana 10 · API annotations
Real-time metrics push. 4 dashboards: agent overview, CB forensics, throughput, alert history.
STREAMLIT Streamlit 1.36 · live feed
Operator dashboard. Alert cards, CB state badge, agent log, dynamic config panel.
MINIO/ICEBERG MinIO · Apache Iceberg
Cold archive. Iceberg snapshots for time-travel queries. DLQ messages as Parquet.
CB API FastAPI · GET /cb/state
HTTP endpoint exposing CB state, failure counts, last trip timestamp. Always queryable.
// 04 · AGENT ARCHITECTURE

DECORATED
INTELLIGENCE

Every capability in Phronis is a @tool. Every agent is a @agent. The decorator pattern keeps the circuit breaker logic orthogonal to the business logic. Agents can be composed, swapped, or extended without touching the CB implementation.

INGEST AGENT
@agent · Kafka consumer · validation
@agent(name="ingest")
Reads from phronis.raw.events. Validates with Pydantic. Routes clean events to processed topic, invalid events to DLQ. Per-partition offset tracking.
DETECTION AGENT
@agent · threshold logic · alert publish
@tool(name="anomaly_detect")
Applies configurable thresholds via @tool decorated functions. Each tool call is wrapped by the circuit breaker. Returns True/False for the alert gate.
ALERT AGENT
@agent · multi-channel publish
@agent(name="alert")
Consumes from alerts topic. Publishes Grafana annotation, pushes to Streamlit state, logs with structlog. Failure in one channel does not block others.
ARCHIVE AGENT
@agent · MinIO · Iceberg snapshots
@tool(name="archive_to_iceberg")
Batches processed events and DLQ messages into Parquet files. Writes Iceberg snapshots to MinIO. Enables time-travel queries over full event history.
// 05 · TECH STACK

THE FULL
STACK

Apache Kafka
CONFLUENT · 5 TOPICS
Partitioned topics: raw events, processed, alerts, DLQ, config. Consumer groups per branch. Offsets committed only on successful processing.
FastAPI
ASYNCIO · CB ENDPOINT
POST /ingest for sensor data ingestion. GET /cb/state for circuit breaker state. Pydantic models for all request and response schemas.
Grafana
v10 · 4 DASHBOARDS
Agent overview, circuit breaker forensics, throughput and lag metrics, alert history. Annotations written via API from the alert agent in real time.
Apache Iceberg
TIME-TRAVEL ARCHIVE
Table format over MinIO Parquet files. Snapshot isolation for concurrent reads. Time-travel queries to any point in event history.
Streamlit
1.36 · OPERATOR UI
Live alert feed, CB state badge, agent status cards, configuration panel for dynamic threshold updates without pipeline restart.
Kubernetes
K8S · HPA CONFIGURED
All services deployed as K8s pods. ConfigMaps for CB thresholds. Persistent volumes for MinIO. Horizontal pod autoscaling on agent consumers.
// 06 · OUTCOMES

BY THE
NUMBERS

<600ms SENSOR TO OPERATOR ALERT
1K+ MESSAGES PER SECOND
5 INDEPENDENT CONSUMER BRANCHES
4 GRAFANA DASHBOARDS LIVE
0 SHARED STATE BETWEEN BRANCHES
K8S FULLY CONTAINERIZED · HPA
// 07 · SYSTEM IN PRODUCTION

THE PLATFORM
AT LOAD

Terminal: normal operations
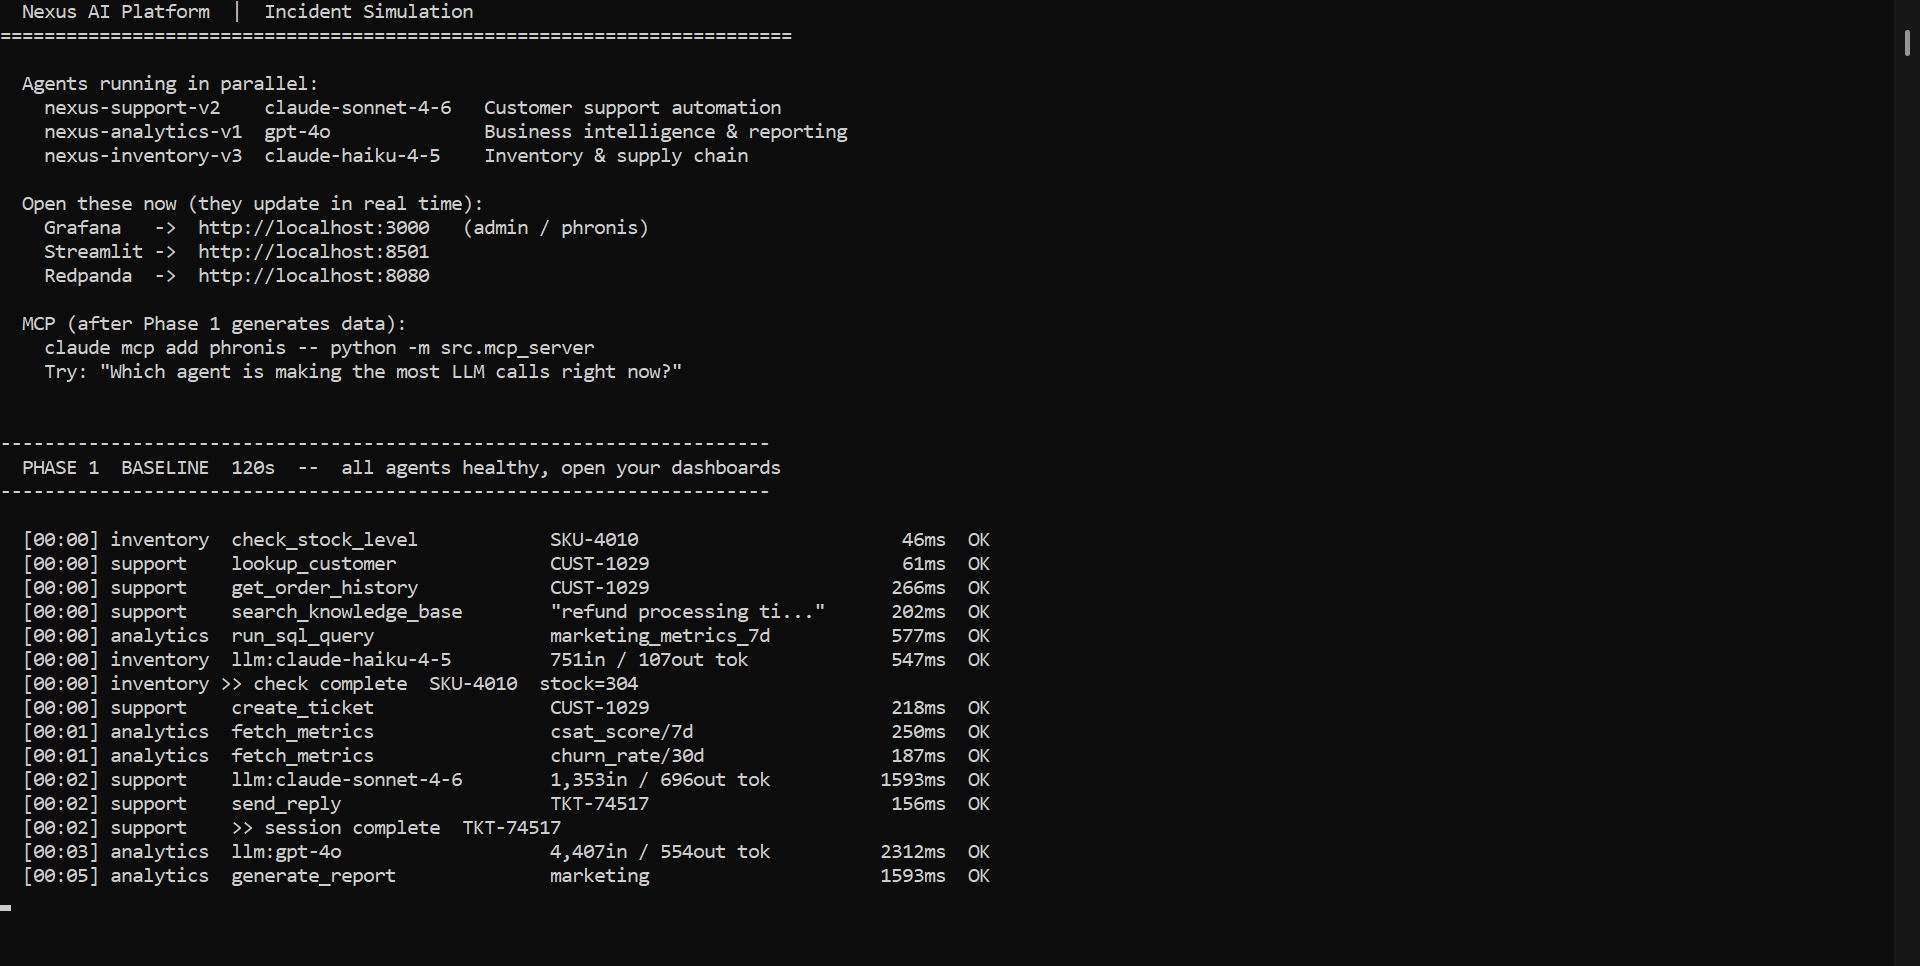
// TERMINAL · PHASE 1 · NORMAL OPERATIONS · ALL AGENTS CONSUMING · CB CLOSED
Terminal: circuit breaker trip
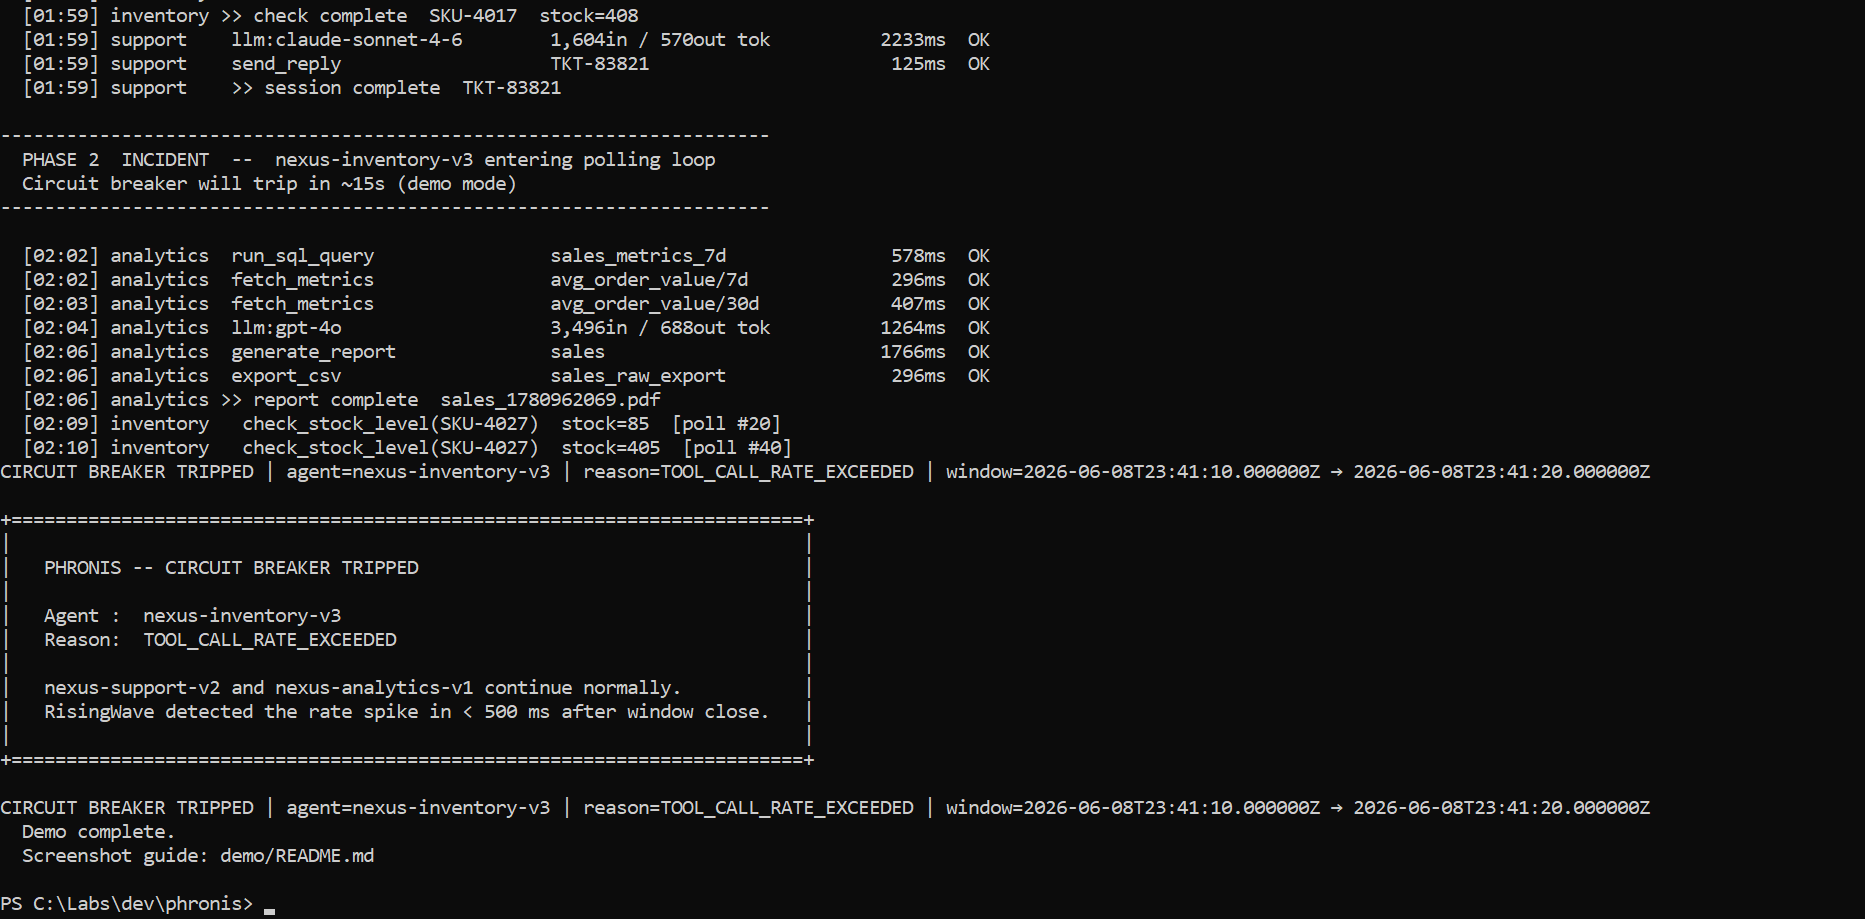
// TERMINAL · CIRCUIT BREAKER TRIP · DLQ ROUTING ACTIVE
Grafana agent overview
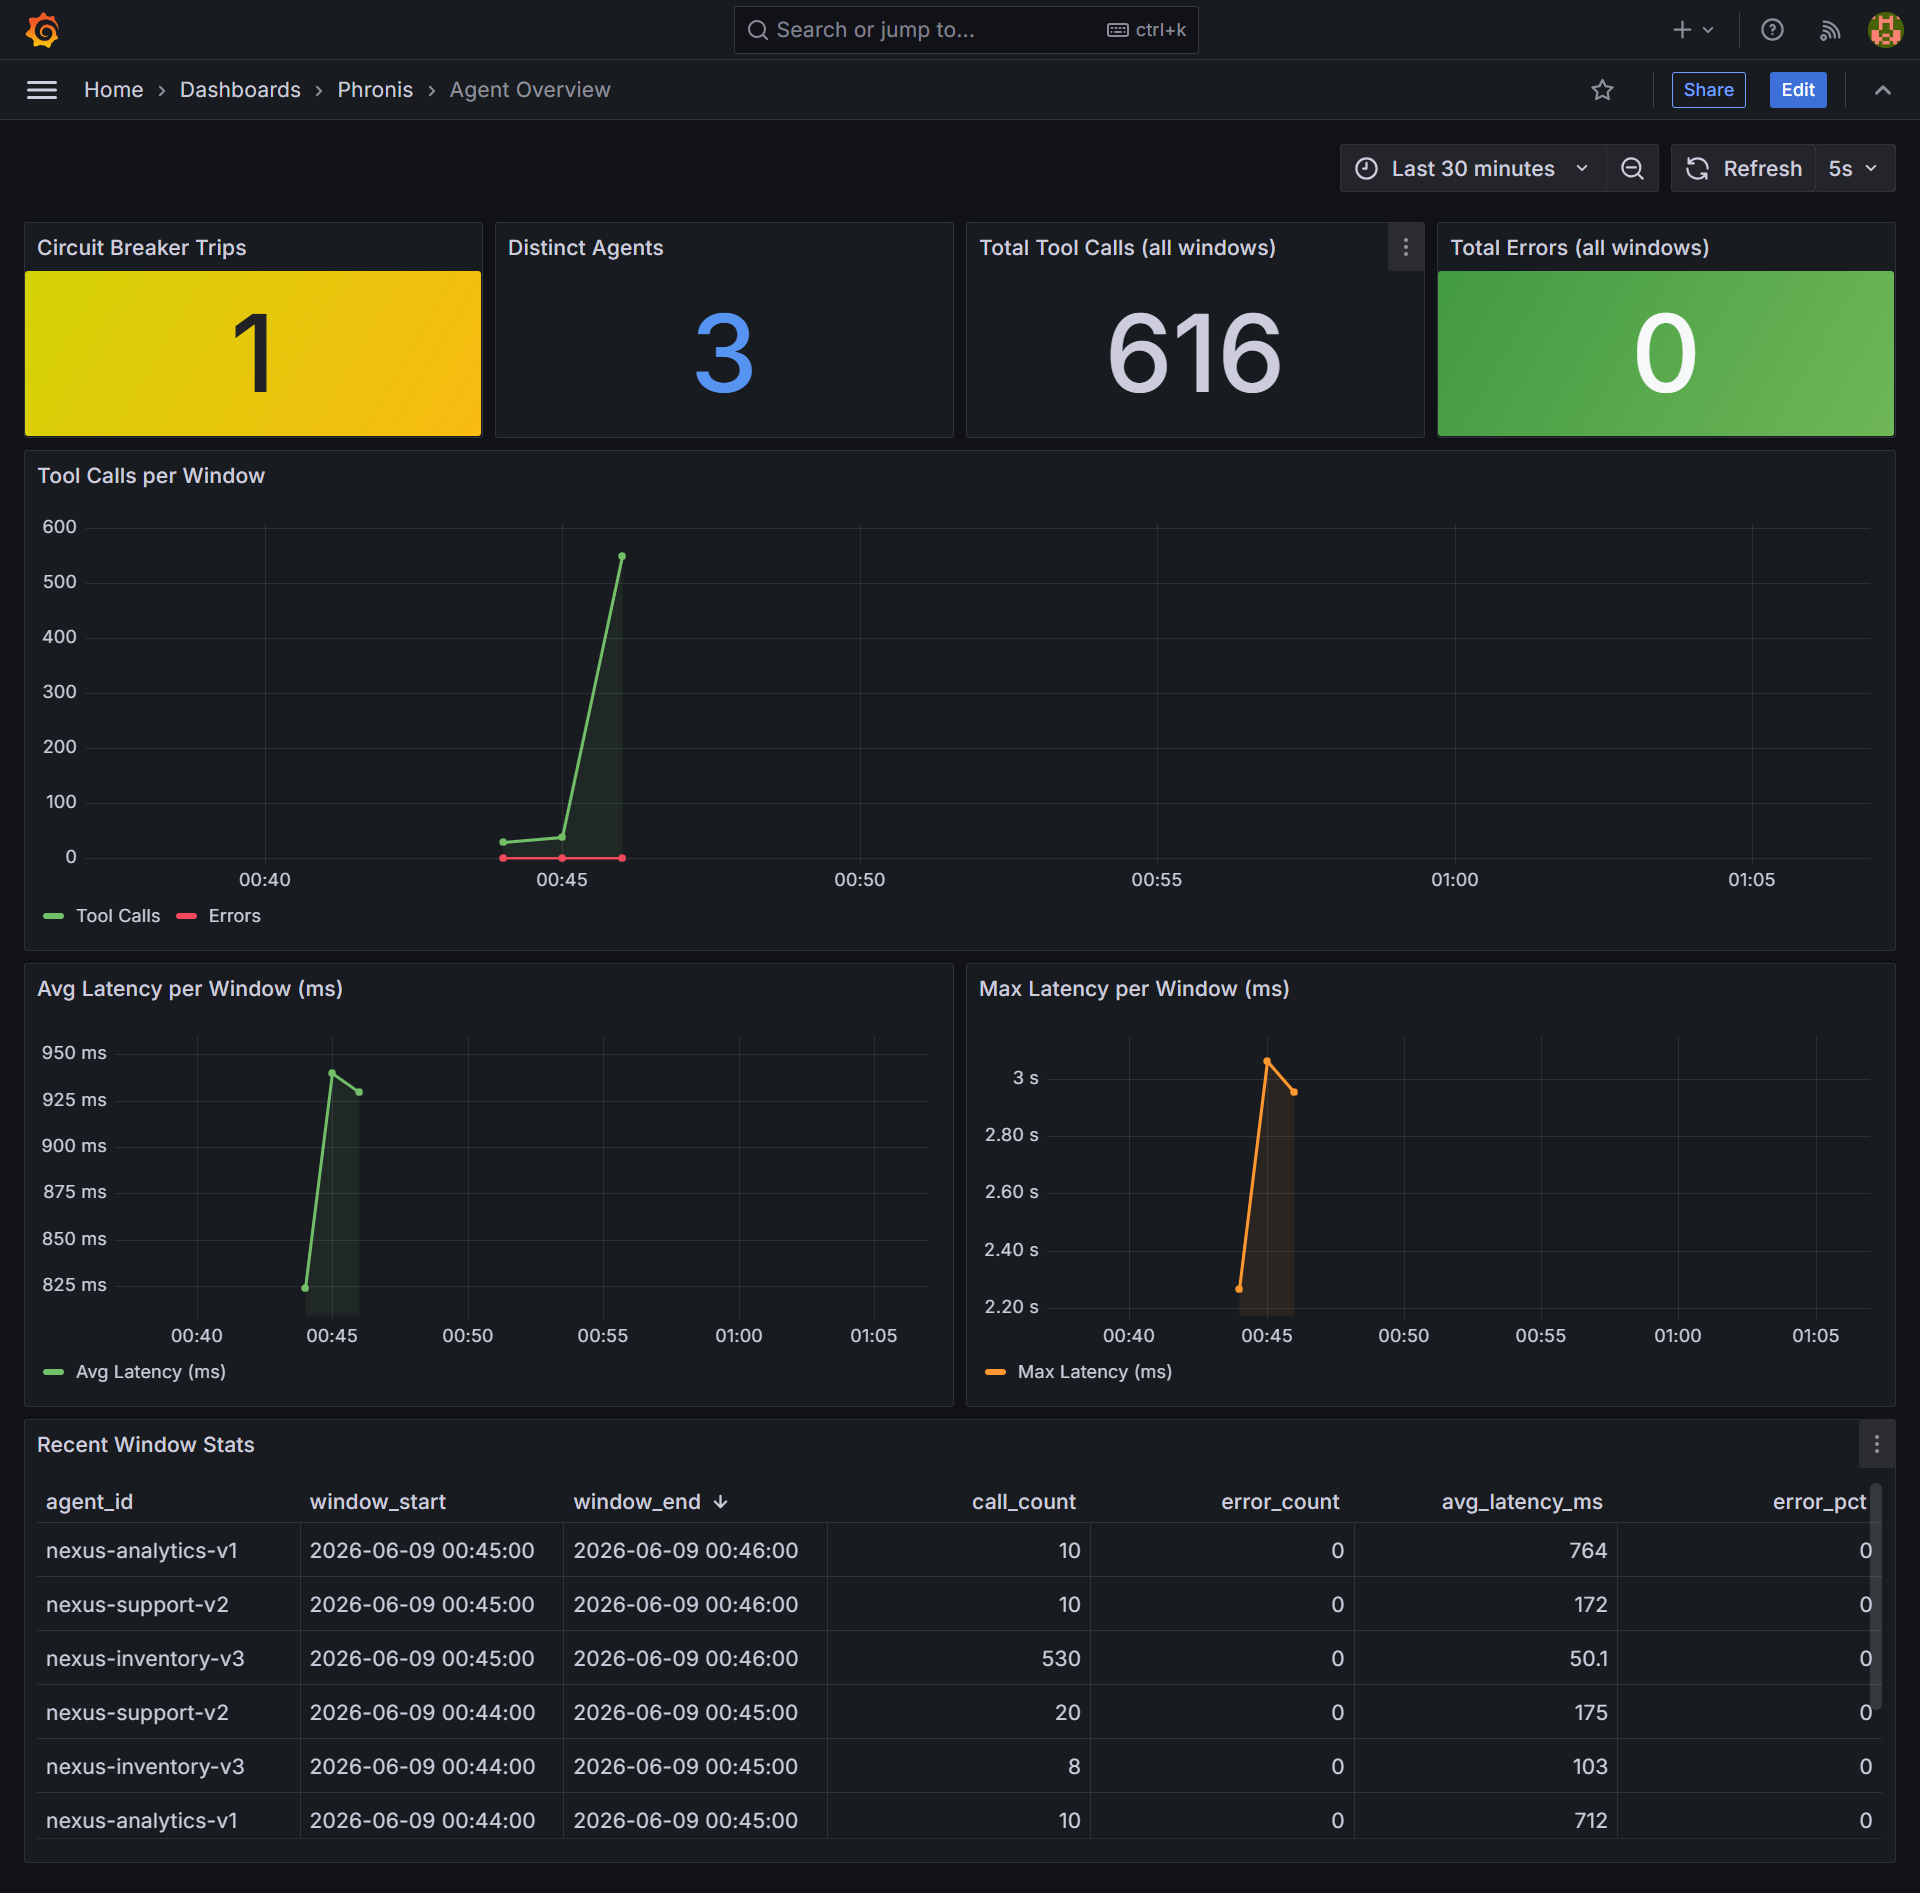
// GRAFANA · AGENT OVERVIEW DASHBOARD · LIVE METRICS
Streamlit operator dashboard
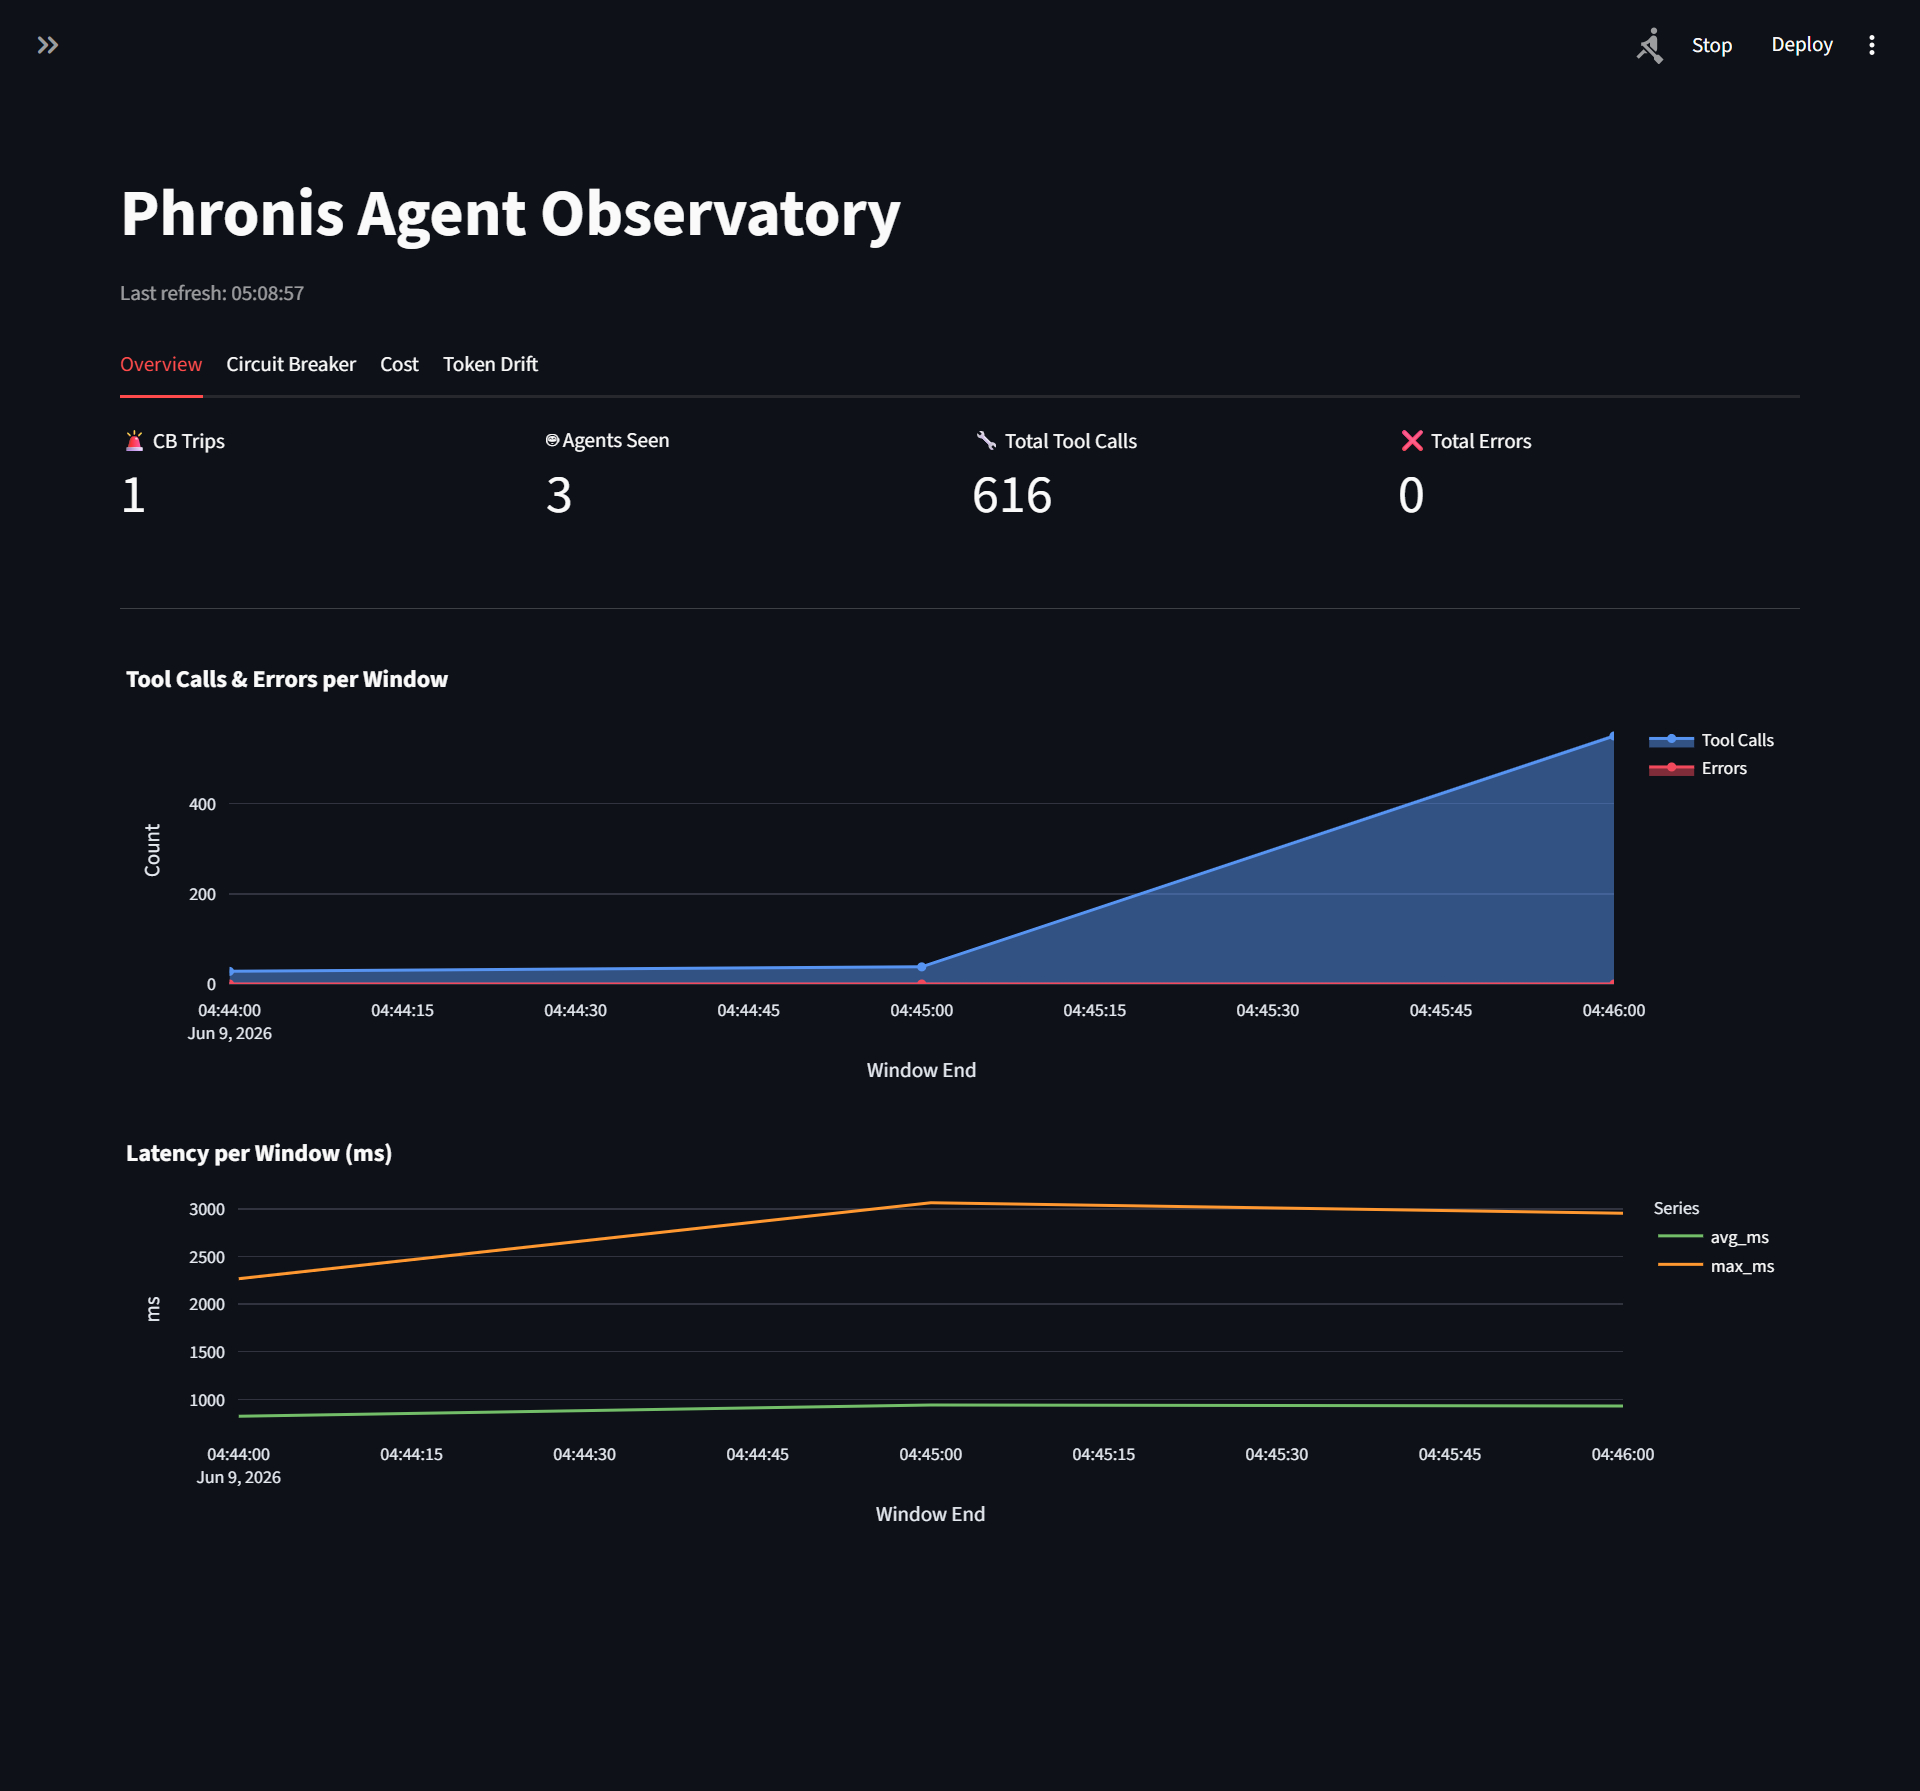
// STREAMLIT · OPERATOR DASHBOARD · ALERT FEED · CB STATE
MinIO Iceberg archive
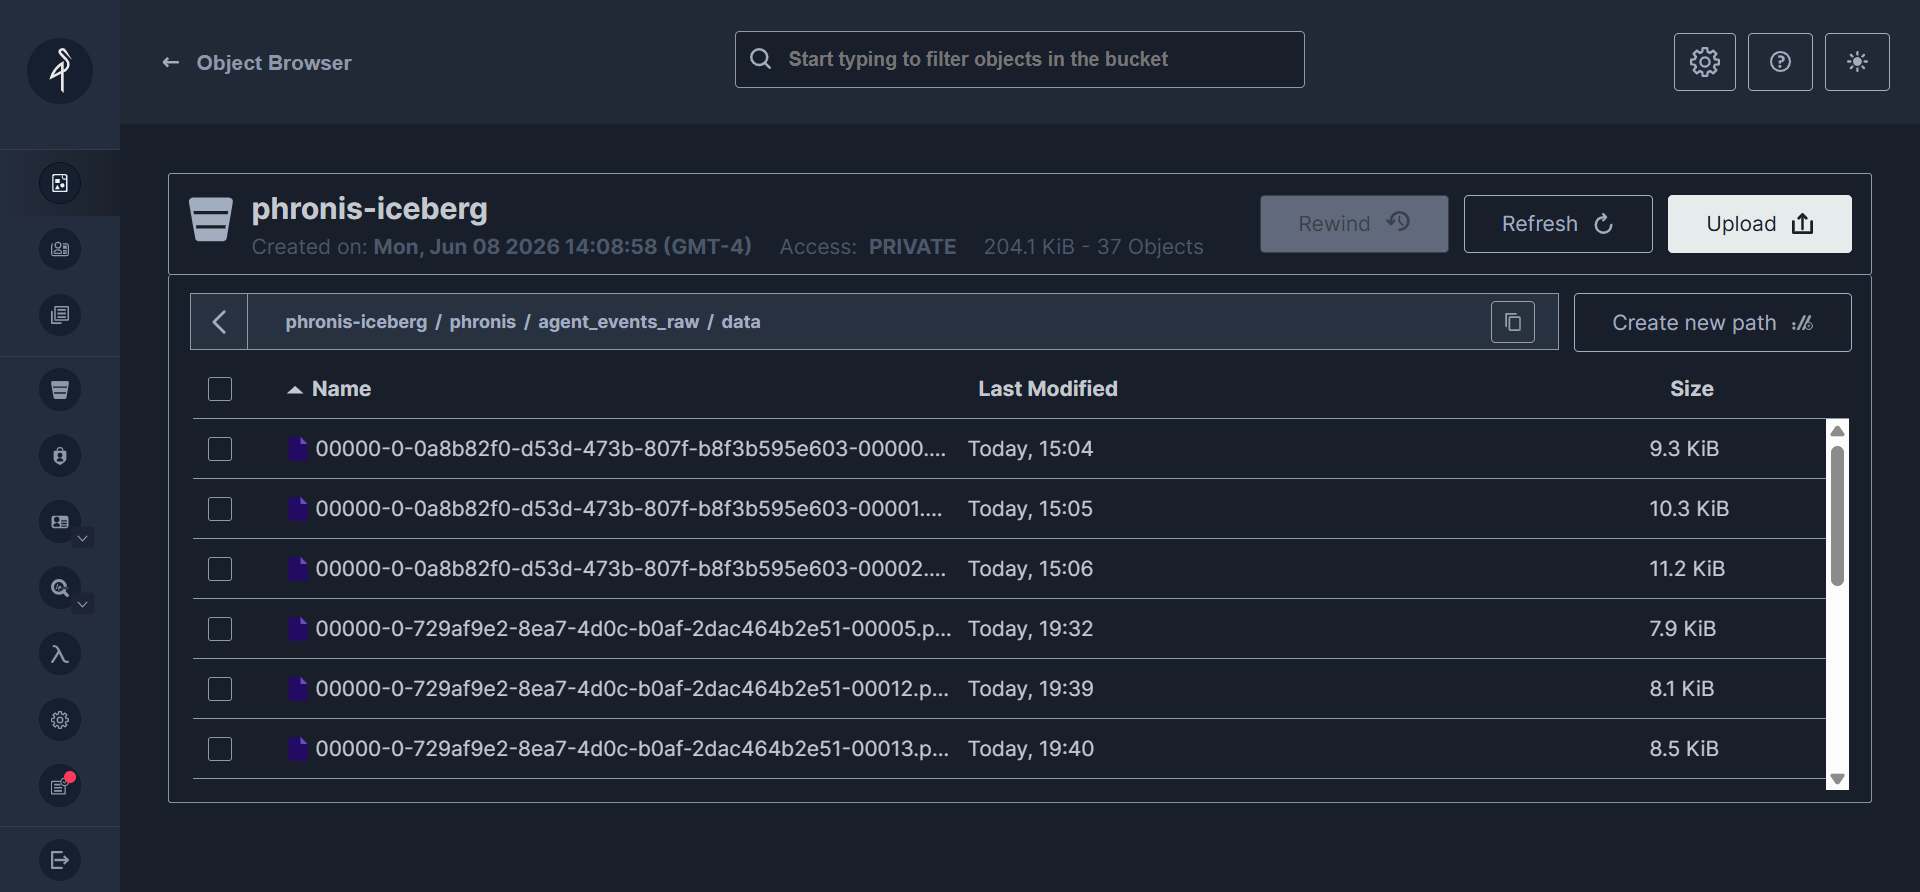
// MINIO · APACHE ICEBERG · PARQUET ARCHIVE · TIME-TRAVEL
Kubernetes pods running
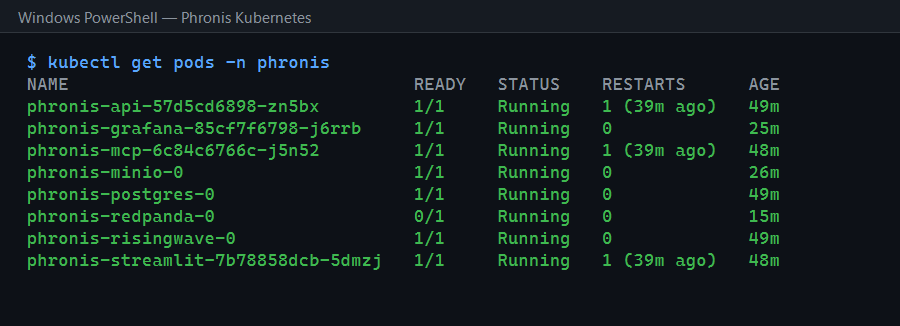
// KUBERNETES · ALL PODS RUNNING · HPA CONFIGURED
// 08 · SOURCE CODE

OPEN
SOURCE

$ git clone https://github.com/frogwebp/phronis
$ docker-compose up -d
$ curl -X POST http://localhost:8000/ingest \
-d '{"sensor_id":"S01","value":98.6}'
# kafka · circuit breaker · iceberg · k8s · grafana

→ VIEW ON GITHUB
PHRONIS · REAL-TIME STREAM PROCESSING · CIRCUIT BREAKER · @FROGWEBP