A/B experiment results are conversion rates with uncertainty. Showing “control: 12%, treatment: 13.4%” without uncertainty is misleading, because that delta might be noise. Spectrum computes Wilson score confidence intervals directly in SQL. This is build log 06.
// 01 — WHY WILSON SCORE, NOT WALD
The naive confidence interval for a proportion is the Wald interval: p ± Z * sqrt(p*(1-p)/n). It breaks at the edges: with very low or very high conversion rates, or with small samples, it produces intervals below 0% or above 100%. Wilson score is better behaved in those regions and is the standard for A/B testing tools.
The formula:
center   = (successes + Z²/2) / (n + Z²)
half     = Z * sqrt(n * p * (1-p) + Z²/4) / (n + Z²)
lower    = center - half
upper    = center + half
where Z = 1.96 for 95% confidence and p = successes / n.
// 02 — THE SQL IMPLEMENTATION
CREATE MATERIALIZED VIEW analytics.mv_experiment_results AS
WITH
z AS (SELECT 1.96 AS val),
counts AS (
    SELECT
        e.experiment_id,
        e.variant,
        e.account_id,
        count(*) AS n,
        count(*) FILTER (WHERE e.converted) AS successes
    FROM warehouse.fact_experiments e
    GROUP BY e.experiment_id, e.variant, e.account_id
),
wilson AS (
    SELECT
        experiment_id,
        variant,
        account_id,
        n,
        successes,
        successes::FLOAT / NULLIF(n, 0) AS conversion_rate,
        -- Wilson interval components
        (successes + (SELECT val FROM z)^2 / 2.0)
            / NULLIF(n + (SELECT val FROM z)^2, 0)                              AS center,
        (SELECT val FROM z) * sqrt(
            n * (successes::FLOAT / NULLIF(n,0))
              * (1 - successes::FLOAT / NULLIF(n,0))
              + (SELECT val FROM z)^2 / 4.0
        ) / NULLIF(n + (SELECT val FROM z)^2, 0)                               AS half_width
    FROM counts
)
SELECT
    experiment_id,
    variant,
    account_id,
    n,
    successes,
    conversion_rate,
    GREATEST(0, center - half_width) AS ci_lower,
    LEAST(1,   center + half_width) AS ci_upper
FROM wilson
WITH NO DATA;
GREATEST(0, ...) and LEAST(1, ...) clamp the bounds to valid probability range.
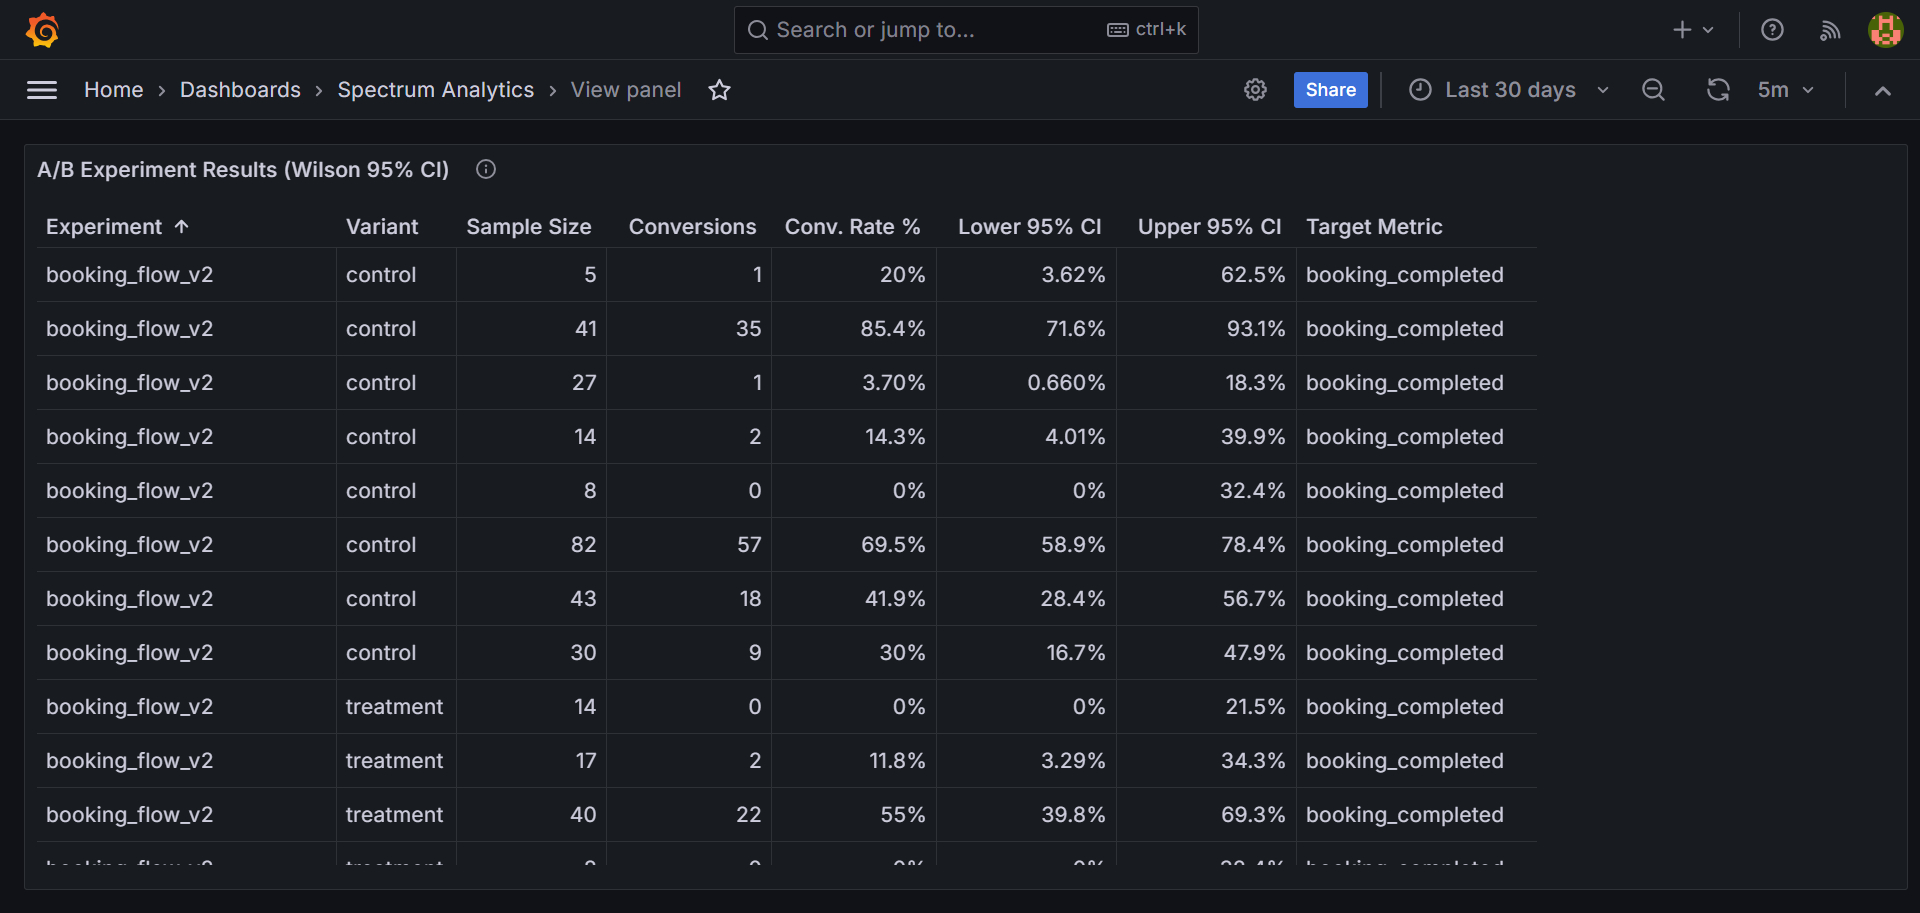
// 03 — READING THE RESULTS IN GRAFANA
Grafana reads ci_lower, ci_upper, and conversion_rate per variant. The dashboard renders them as error bars: if the control and treatment intervals don’t overlap, the difference is significant at 95% confidence. No statistical library required. The warehouse exports ready-to-visualize numbers.
// 04 — WHAT’S NOT HERE
Statistical significance is not the same as practical significance. A 0.1% conversion lift that’s “significant” with 100,000 users per arm is not necessarily worth acting on. Spectrum shows the intervals; the human decides whether the delta matters for the product.
Spectrum also doesn’t handle sequential testing (running an experiment and peeking at results repeatedly without adjustment). For now, experiments are evaluated once at their end date.
NEXT
- Build log 07: sessionization: defining “a session” in pure SQL and why standard approaches break.